Learning Tableau? Here are 3 concepts you need to know
Here are 3 foundational concepts that will help you demystify and master Tableau.
Tableau Desktop is an analytics and visualization package that empowers many to explore, understand and present their data. It is easy to get started with Tableau, but you could also start on the wrong foot.
While it seems easy to use, with easy dragging and dropping that easily create charts almost magically, it can get confusing right away. The dragging and dropping can turn into many, many un-dragging and un-dropping, a string of clicks on the undo button (or Ctrl+Z if you’re into keyboard shortcuts), and possibly many headaches and frustration.
Here are 3 foundational concepts that I think you should master first to ensure your next steps are smoother.
#1 Rows vs Columns
We also call these Rows shelf and Columns shelf. When you place a pill (or data field) to either of these, something will be drawn.
Here’s the thing — pay attention to the icons in the shelf. Look at the orientation of the little squares — these will help you determine how what you place there will be drawn.

Columns = Horizontal : Whatever you place in the Columns shelf will be drawn horizontally, or placed side by side.
Rows = Vertical :Whatever you place in the Rows shelf will be drawn vertically, or stacked one on top of the other.
For example, in a horizontal bar chart, the Sales field (which by default is drawn as a bar and has an accompanying axis) would need to be placed in Columns. The labels for each bar, if we want them to be stacked vertically, will need to be in Rows.

If we want a vertical bar chart instead, we need these fields transposed. We will need the Sales pill in Rows, and the Region in Columns.

#2 Dimensions vs Measures
Dimensions and measures are all about what the data represents.
Dimensions are descriptors — they help define and provide context to your data. Often we use dimensions to slice up our measures.
Measures are quantitative (numeric) values we want to analyze and aggregate.
In Tableau, these are categorized in the side bar. The faint line you see separates out dimensions and measures. Another big difference between dimension and measure behavior is when we drag measures to our canvas, these are aggregated by default.
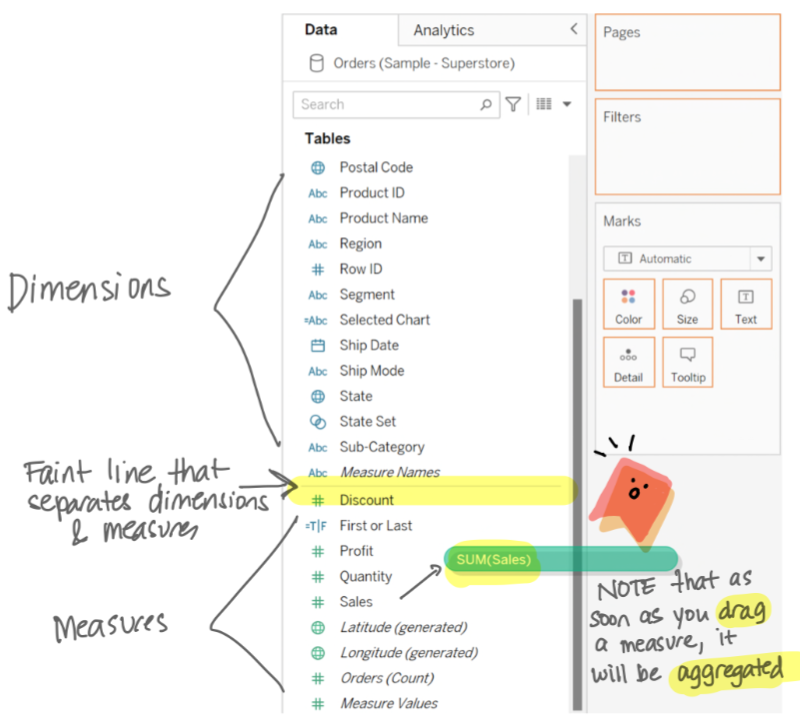
In previous versions of Tableau, there were clear headings for Dimensions and Measures. However, with the introduction of the new data model and Relationships in v2020.2, the default headers disappeared. They are still visible when you drag a field from one section to the other.
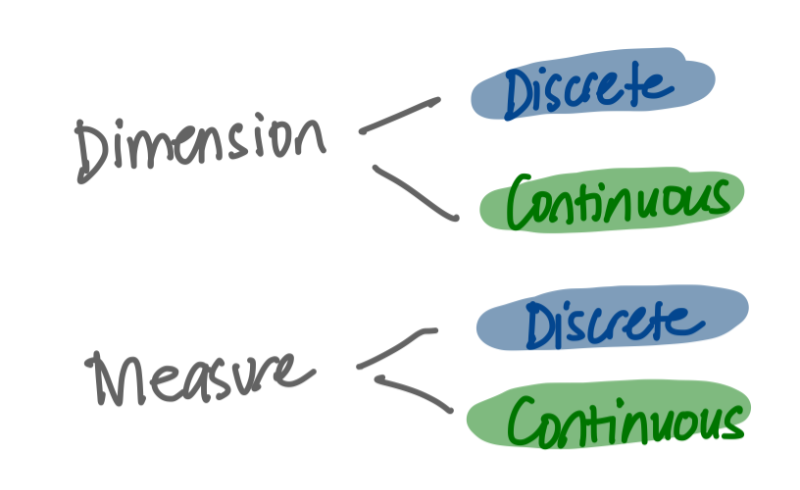
#3 Blue vs Green
Last but not least is the concept of blue and green.
Blue fields in Tableau are discrete fields, and green fields in Tableau are continuous fields.
To better understand these terms, I’ve referenced the Oxford dictionary:
Discrete (blue) means “individually separate and distinct”
Continuous (green) means “forming an unbroken whole; without interruption”
How this is significant in Tableau is because this determines how we are displaying our data points.
Blue or discrete fields are displayed as headers (or slicers). Each individual value is displayed and/or used.
Green or continuous fields are displayed as continuous ranges or axes.
If placed in the Columns shelf, it will be a horizontal or x-axis.
If placed in the Rows shelf, it will be a vertical or y-axis.
If placed in the Color property in the Marks card, it will (by default) produce a gradient of colors.
If placed in Filter shelf, it produces a range / slider.
Blue and green is still about the display, not the data type.
What is important to note is that the type of data (dimension or measure) has little to do with blue or green. Many fields can be displayed as either — it really just depends on how we want to visualize the data.
Want to learn more?
If you are interested in learning more, I’ve covered this in more detail in the following video tutorial: